We use MathJax
 |
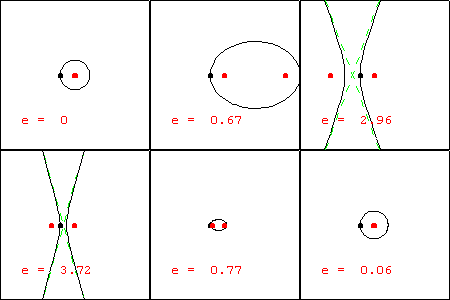
This animation displays the effect of variations in the eccentricity of a conic section. We have fixed one vertex of the conic (the black point located at $(-1,0)$ ), and one of the foci (the fixed red point at $(0,0)$ ). The moving red point is the other focus. These choices produce the polar equation $r(\theta)=\dfrac{1+e}{1-e\cos\theta}$ for the conic, where the absolute value of the parameter e is the eccentricity. If converted to rectangular form, the equation of the conic is $\dfrac{\left(x-\frac{e}{1-e}\right)^2}{\left(\frac{1}{1-e}\right)^2}+ \dfrac{y^2}{\left(\sqrt{\frac{1+e}{1-e}}\right)^2}=1$. To produce the display, we have allowed the parameter e to vary among all real numbers, both positive and negative. Recall that the conic with eccentricity larger than one is a hyperbola, and the conic with eccentricity less than 1 is an ellipse. A circle has eccentricity zero, and a parabola has eccentricity one. The discontinuity that occurs when the hyperbola changes into the ellipse (with the momentary display of a horizontal line) is worth some discussion. Using the rectangular form of the equation, this horizontal line occurs when $e=-1$. The same value of $e$ in the polar form produces a zero radius for all angles excepting 180 degrees, when the value is undefined. We have chosen to display the rectangular result. |
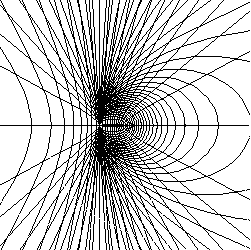
For those of you who like a little "op art", we offer the 48 frames of the conic superimposed.
