We use MathJax
As we previously noted, a point estimate is almost certain to be incorrect, but an interval estimate can have a high probability of containing the correct value of the population parameter. Let us consider the situation of obtaining a confidence interval for a mean.
When the population standard deviation $\sigma$ is known, the sample mean distribution will follow a normal distribution. However, that is rarely the case in practice. When the population standard deviation $\sigma$ is unknown, and the sample standard deviation $s$ is used in its place, the sample mean distribution will follow the Student's t-distribution with $df = n-1$ degrees of freedom.
To identify the correct formula for the confidence interval of the population mean, we need to determine whether the population standard deviation is known or not, whether the sample size is large or not, and whether the original population was normally distributed or not. In each case, we assume a sample of size $n$ had a sample mean of $\bar{x}$.
A sample of 150 county residents finds the mean educational level to be 12.2 years. Suppose it is known that $\sigma = 3.1$ years. Find a 95% confidence interval for the population mean.
In other words, we can be 95% confident that the mean educational level of the population falls between 11.7 years and 12.7 years.
This situation is really quite unrealistic. If you need to sample in order to obtain an estimate for the mean, how is it that you already know the standard deviation? Yet this type of problem is still valuable pedagogically, for it provides us with a better understanding of the relationship between the quantities we observe and the confidence obtained in our interval estimates.
The manager of a tree nursery measures the heights of 39 seedlings and obtains a mean and standard deviation of 58.5 cm and 4.3 cm, respectively. Find the 90% confidence interval for the population mean.
We can be 90% confident that the mean height of the seedlings is between 57.3 cm and 59.7 cm.
Before the advent of powerful calculation tools, statisticians frequently used the normal distribution as an estimate of the t-distribution when the sample size was large. If we had done this, we would have obtained a confidence interval of heights between 57.4 and 59.8 cm. The result would have been close, but the difference gives a false impression of slightly greater precision in our estimate.
A researcher studies the lengths (in meters) of skids on a road, and obtains the following data.
| 438, 303, 408, 155, 237, 366, 383, 521, 381, 492 329, 247, 144, 203, 226, 351, 265, 264, 103, 372 |
Find the 95% confidence interval for the mean length of a skid.
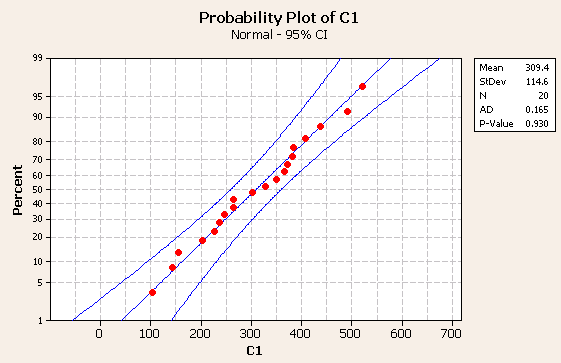
We can be 95% confident that the mean skid length is between 255.8 meters and 363.0 meters.
Given a particular sample size, we should notice that to increase our confidence in our estimate, we had to enlarge the interval, thus decreasing the precision with which we know the result. And similarly, increasing the precision will decrease the confidence. If we want both the confidence in being correct, and a fairly precise answer, then we need to increase the sample size.
Sample size estimates are usually done with the normal distribution, even though the population standard deviation may not be known. This is because the t-distribution does approach the normal distribution as the sample size increases, and is approximately normal when the sample is large ($n \ge 30$).
The confidence interval formula was $\bar{x} \pm z_{\alpha/2} \dfrac{\sigma}{\sqrt{n}}$. The margin of error is defined to be the distance from the center to the end of the interval, and is denoted by the variable $E$. Therefore, we have the equation $E = z_{\alpha/2} \dfrac{\sigma}{\sqrt{n}}$. This equation can be solved for $n$ to produce the following formula.
| $n = \left( \dfrac{ z_{\alpha/2} \sigma}{E} \right)^2$ |
It is common practice to round the result up to the nearest integer. If the population standard deviation $\sigma$ is unknown, then the sample standard deviation $s$ should be substituted for $\sigma$. If no standard deviation is known because the data has not yet been collected, a small pilot sample (with sample size at least 30) should be collected to estimate the standard deviation.
As an example, suppose the learning time for a particular task has a standard deviation (estimated from at least 30 observations) of 4.3 minutes. What sample size would be needed to estimate the mean learning time to within 0.5 minutes, with a confidence of 99%?
Rounding up, we find that we should have 491 observations in our sample in order to achieve an estimate with a margin of error at most 0.5 minutes, and have 99% confidence in the result.